People Census 2013: Our personal income

Latest census data reveals changes to Kiwis' personal income
Latest census data reveals changes to Kiwis' personal income


Last updated: 08/11/2015

Recommended stories

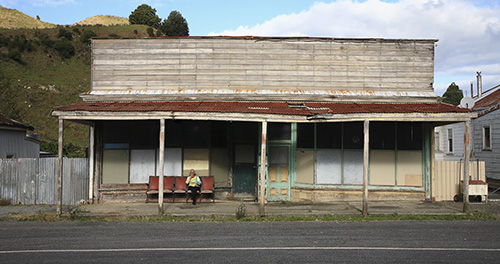
Personal income has fallen dramatically in South Auckland compared to more affluent Auckland areas, according to the latest Census data.
The Mangere-Otahuhu local board area has seen its median income drop from $19,900 to 19,700 between 2006 and 2013. When adjusted for inflation over the same period, the median income for the board dropped by 16 per cent.
The same comparison in the neighbouring Otara-Papatoetoe and Manurewa local boards reveals a decrease of 17 per cent each.
But Orakei, which includes Remuera, Mission Bay and St Heliers, has the highest median income of $42,700 among the local boards created after the 2010 Supercity elections.
This is an increase of $6,100 since the last census but a decrease of less than one per cent when adjusted for inflation.
Overall, the median income within Auckland has increased from $26,800 to $29,600 between 2006 and 2013. This figure comes to $25,170 when adjusted for inflation.
However, Ann Ball from Statistics New Zealand said it is not easy to make inferences about the changes in income.
"The census data gives a snapshot in time of place. The people who lived in an area there in 2006 might not be living in the same area in 2013."
She said the median income does not include the number of people who fail to declare their income but does include people declaring zero, or no source of income.
"Zero income can be considered as a sort of a soft refusal, where people don't want to reveal their income, so they select zero instead of not answering."
Ms Ball said the response rate for the areas tells the real story.
"You get a higher non-response rate from Pacific peoples when compared with Maori and European."
The non-response rates for Pacific peoples in this census for income survey was 11.3 per cent
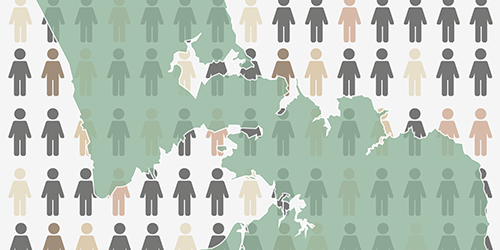
The ethnic breakdown of local board areas shows that Mangere-Otahuhu has highest proportion of Pacific population at 55 per cent, according to an interactive Herald map created to analyse the data.
Alan Johnson, a social policy analyst from the Salvation Army Social Policy and Parlimentary Unit, said the income reporting does have an ethnic dimension but there is a "circular pattern" emerging.
"Some of the patterns might be due to the reporting having an ethnic dimension.
But Maori and Pacific people have been hit hardest by the recession and the quarterly income data does show that these populations have suffered the most."
Ms Ball said median income is affected by those who say they receive no income.
"Young people tend to not fill out the income survey. This increases the count of population with zero income."
However, Mr Johnson said there has been a decline in employment for the younger population in last 4 to 5 years.
"Young people are struggling to find work and it's a genuine reflection of their circumstances. Most of them are being supported by their families now."
He said the income data is also uneven because of different types of households.
"If it's a salaried household then the income is known, but in other types of households that is not the case.
"There has definitely been material growth which is not reflected in the median income statistics."
He said it will be easier to analyse income differences in detail when Meshblock-level data is released in March next year.
The income data was released as part of the Statistics New Zealand census release this month. The income question has one of the highest non-response rates with 9.7 per cent of respondents refusing to answer the question.
Non-response means an individual gives no response at all to a census question that was relevant to them, according to Statistics New Zealand.
High non-response rates can lead to bias in the data.
It could also lead to the number of people within the low-income bands being under-counted.
The data reflects personal received income rather than earned income and is rated to be of moderate quality by Statistics New Zealand.