People How your neighbourhood will change by 2038
Auckland is set to become an ever-more diverse city. See how it will change at local board level, and how it compares with the rest of New Zealand.
Auckland is set to become an ever-more diverse city. See how it will change at local board level, and how it compares with the rest of New Zealand.
Auckland’s future diversity is going to be stratified according to geographic and economic lines.
Herald Insights interactive allows readers to explore the changes for each local board area and territorial authority.
Below are eleven interesting insights and context on how these projections are calculated and what they mean.
_The interactive is based on medium projections by StatisticsNZ and please note these projections are not predictions. The report from Statistics NZ is available here.
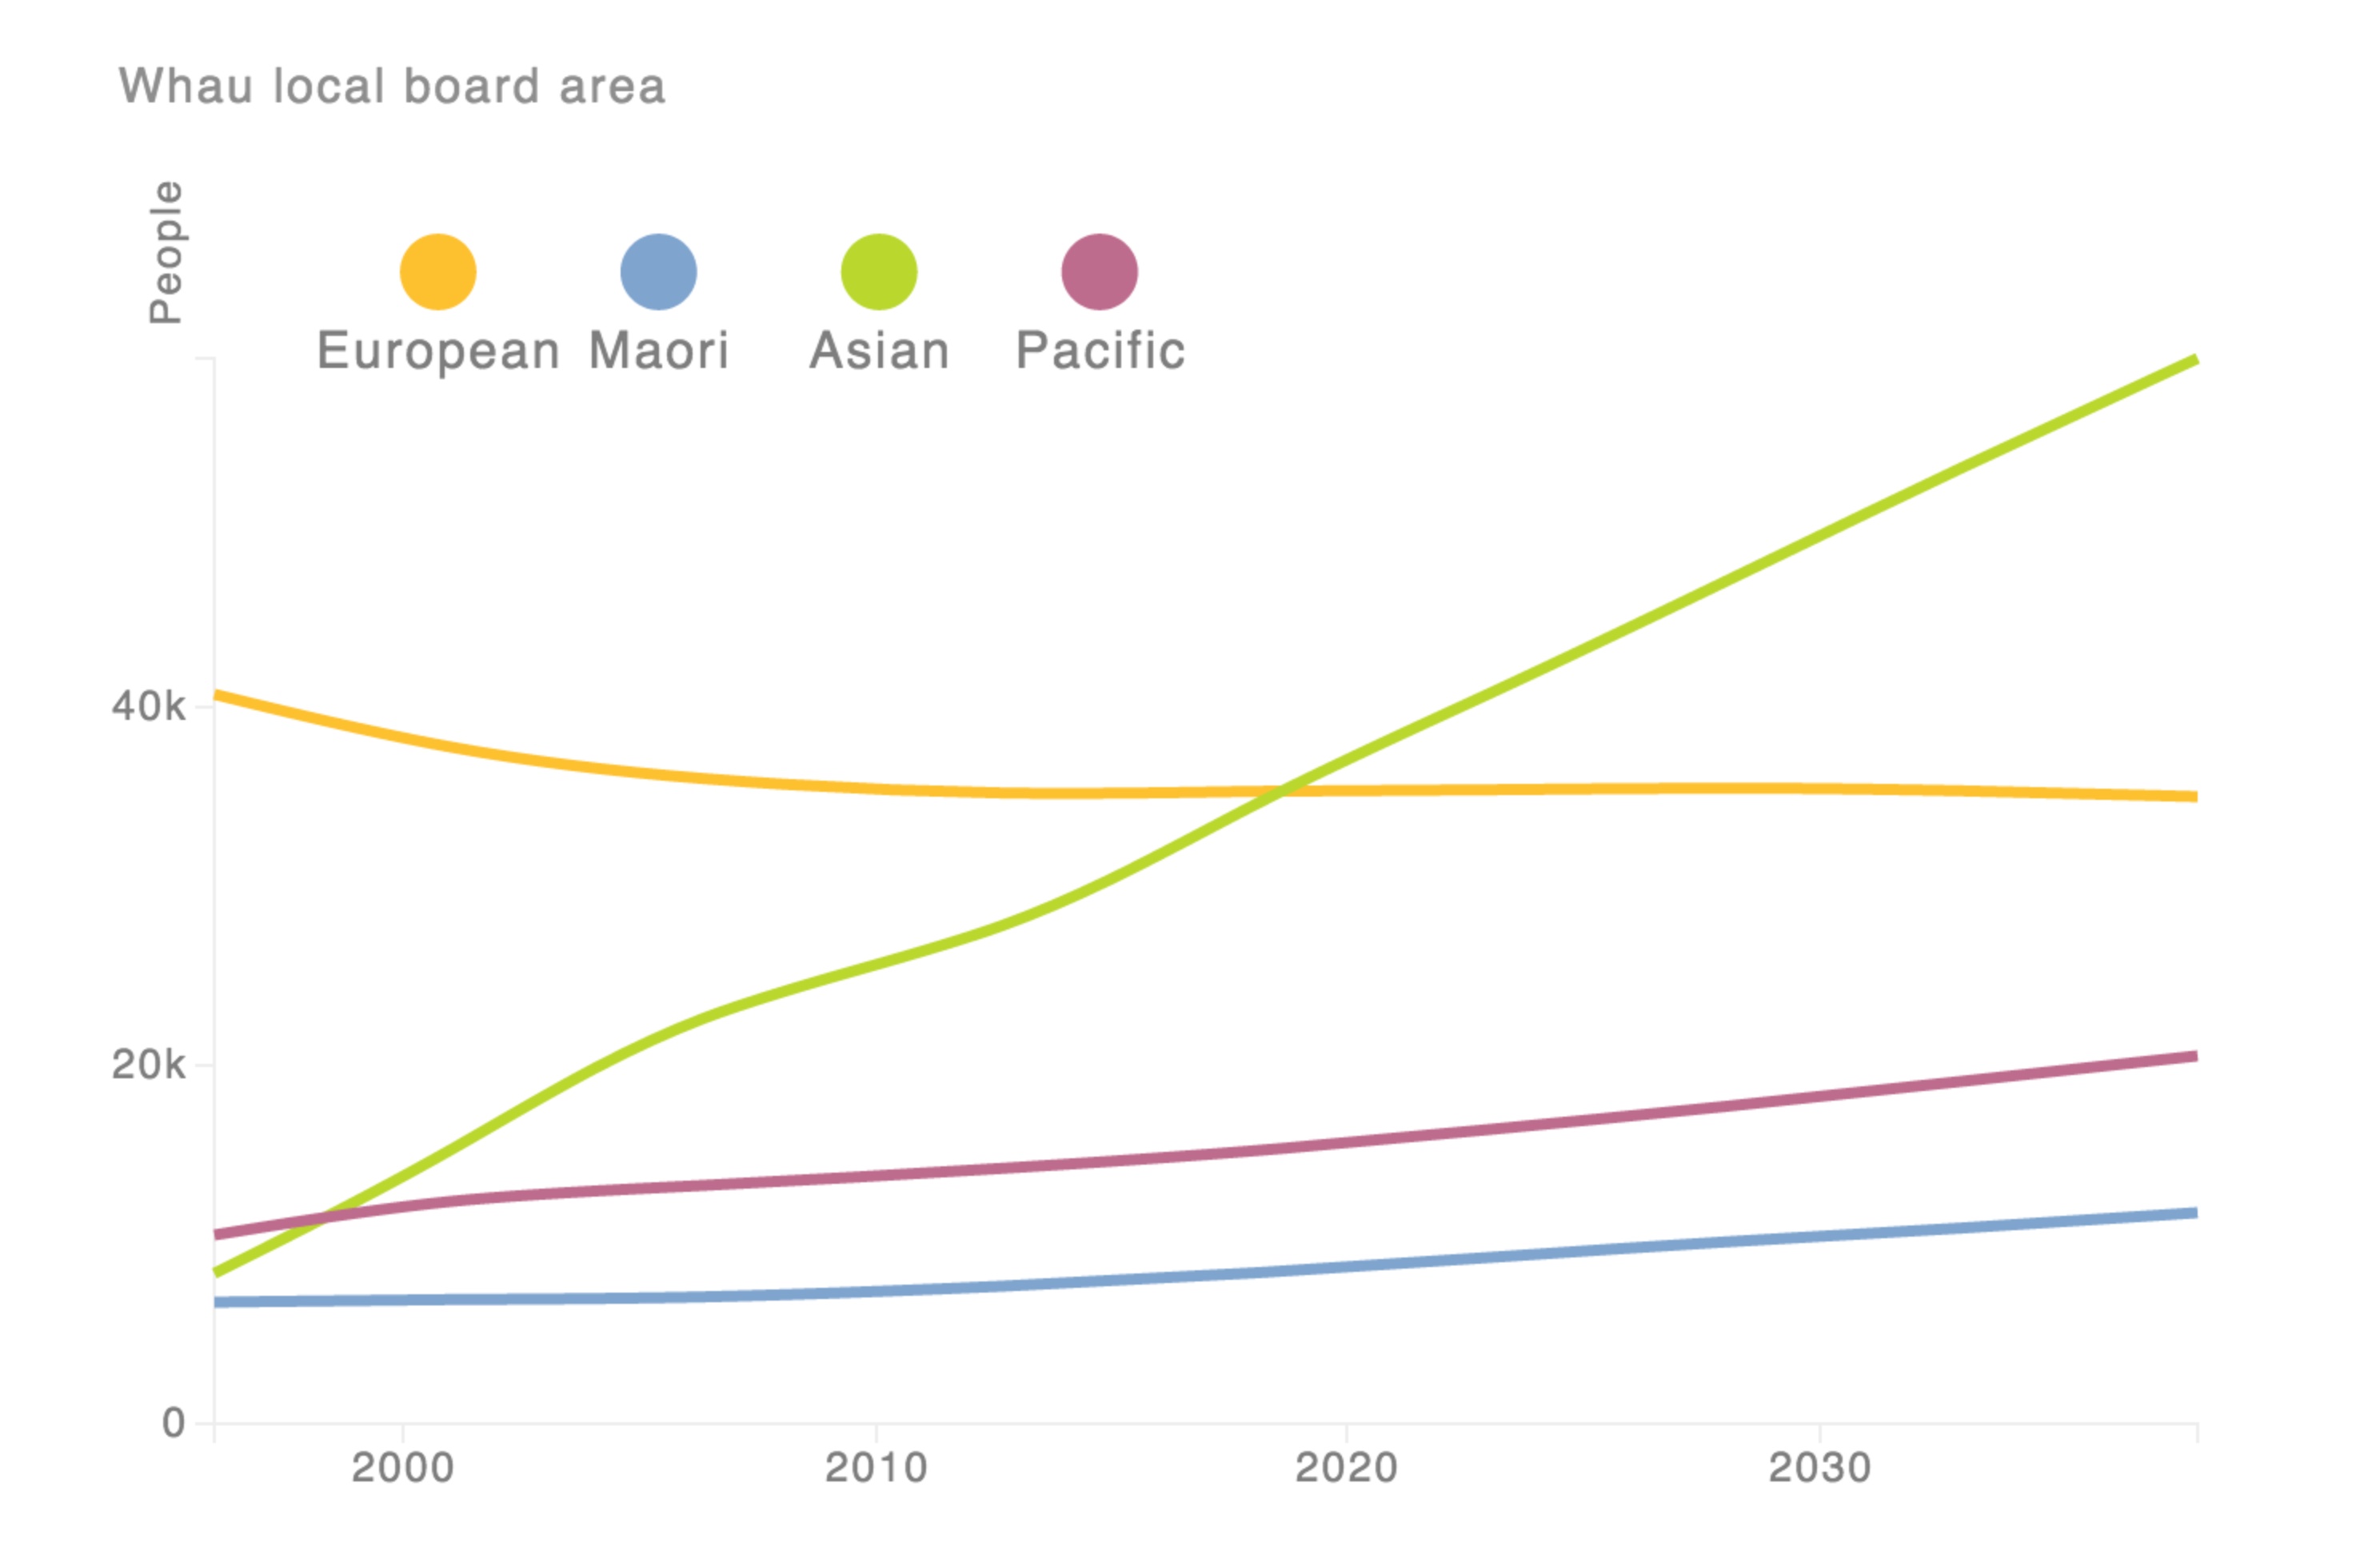
Whau Local Board area will see its proportion of European population decline from 68 percent in 1996 to 31 percent in 2038. It includes the suburbs of New Lynn, Green Bay, Kelston, Rosebank, Avondale, New Windsor and Blockhouse Bay.
Manurewa local board area will see a decline of European population from 62 percent in 1996 to 17 percent in 2038, while the Pacific population rises from 20 percent to 62 percent in the same period.
Wellington will see the Asian population rise from 9 percent in 1996 to 24 percent in 2038. Only Auckland will have more Asian population.
Wairoa, Kawerau, Opotiki and Gisborne districts are projected to have more than 60 percent of population in 2038 which identifies as Maori.
Porirua city is projected to have the highest proportion of Pacific population in 2038 at 31 percent amongst territorial authorities.
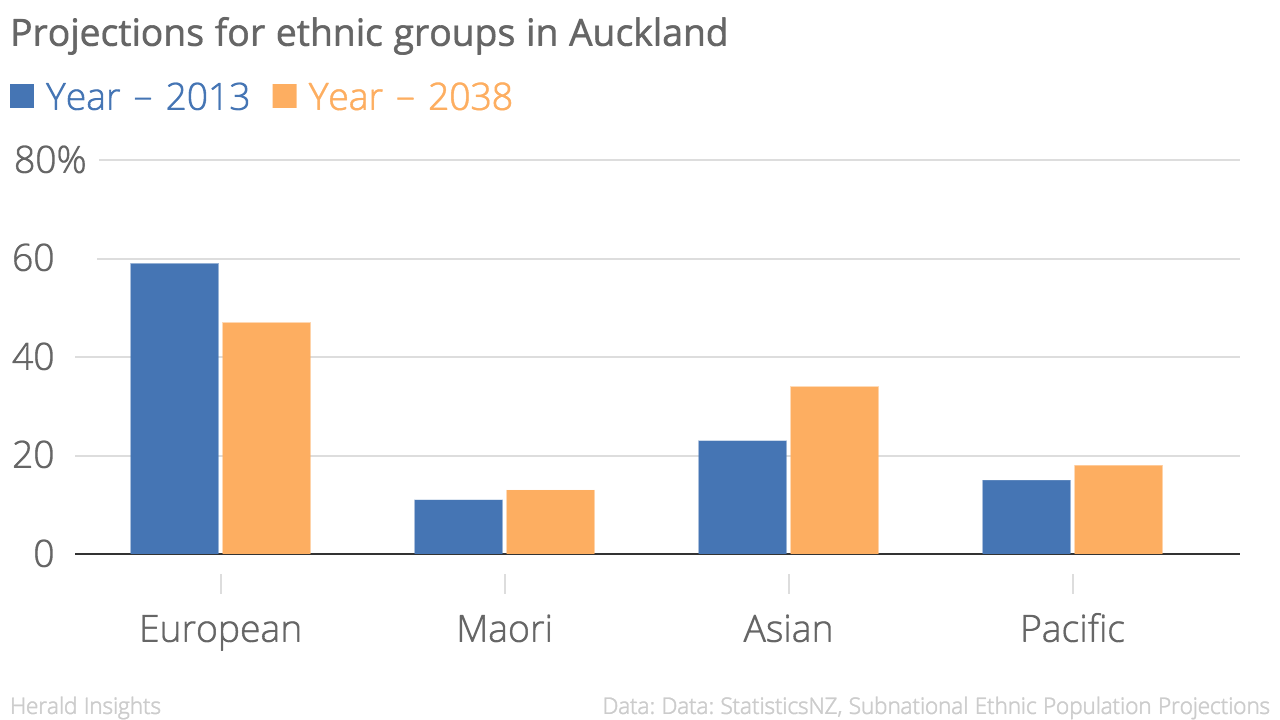
Auckland’s proportion of Maori population will stay the same from 1996 to 2038 at 13 percent.
Waiheke, Rodney and Franklin board areas will have high proportion of European population at 89, 83 and 80 percent in 2038.
People can have more than one ethnicity and they can decide to identify with a different one after a period. This means the proportions add to more than 100.
Hamilton will be one of the most diverse cities by 2038, with 28 percent Maori, 23 percent Asian and 10 percent Pacific population. Except for the higher number of Maori, it will reflect Auckland in 2013.
Cities in South Island such as Dunedin and Christchurch will see a growth in Asian population but Pacific population will only change by 2 and 3 percent.
Otara-Papatoetoe local board area will see its European population drop from 41 percent in 1996 to 7 percent in 2038, while the Asian population rises from 10 to 48 percent.
Diversity is never equally distributed, for reasons including history, immigration and socio-economic patterns.
Herald Insights interactive breaks down the projection data to show the spread of diversity in Auckland and New Zealand.
Areas like Whau, Otara-Papatoetoe and Manurewa show an increase in Asian, or Pacific ethnicities. They also tend to see a loss or stagnation in European population. 
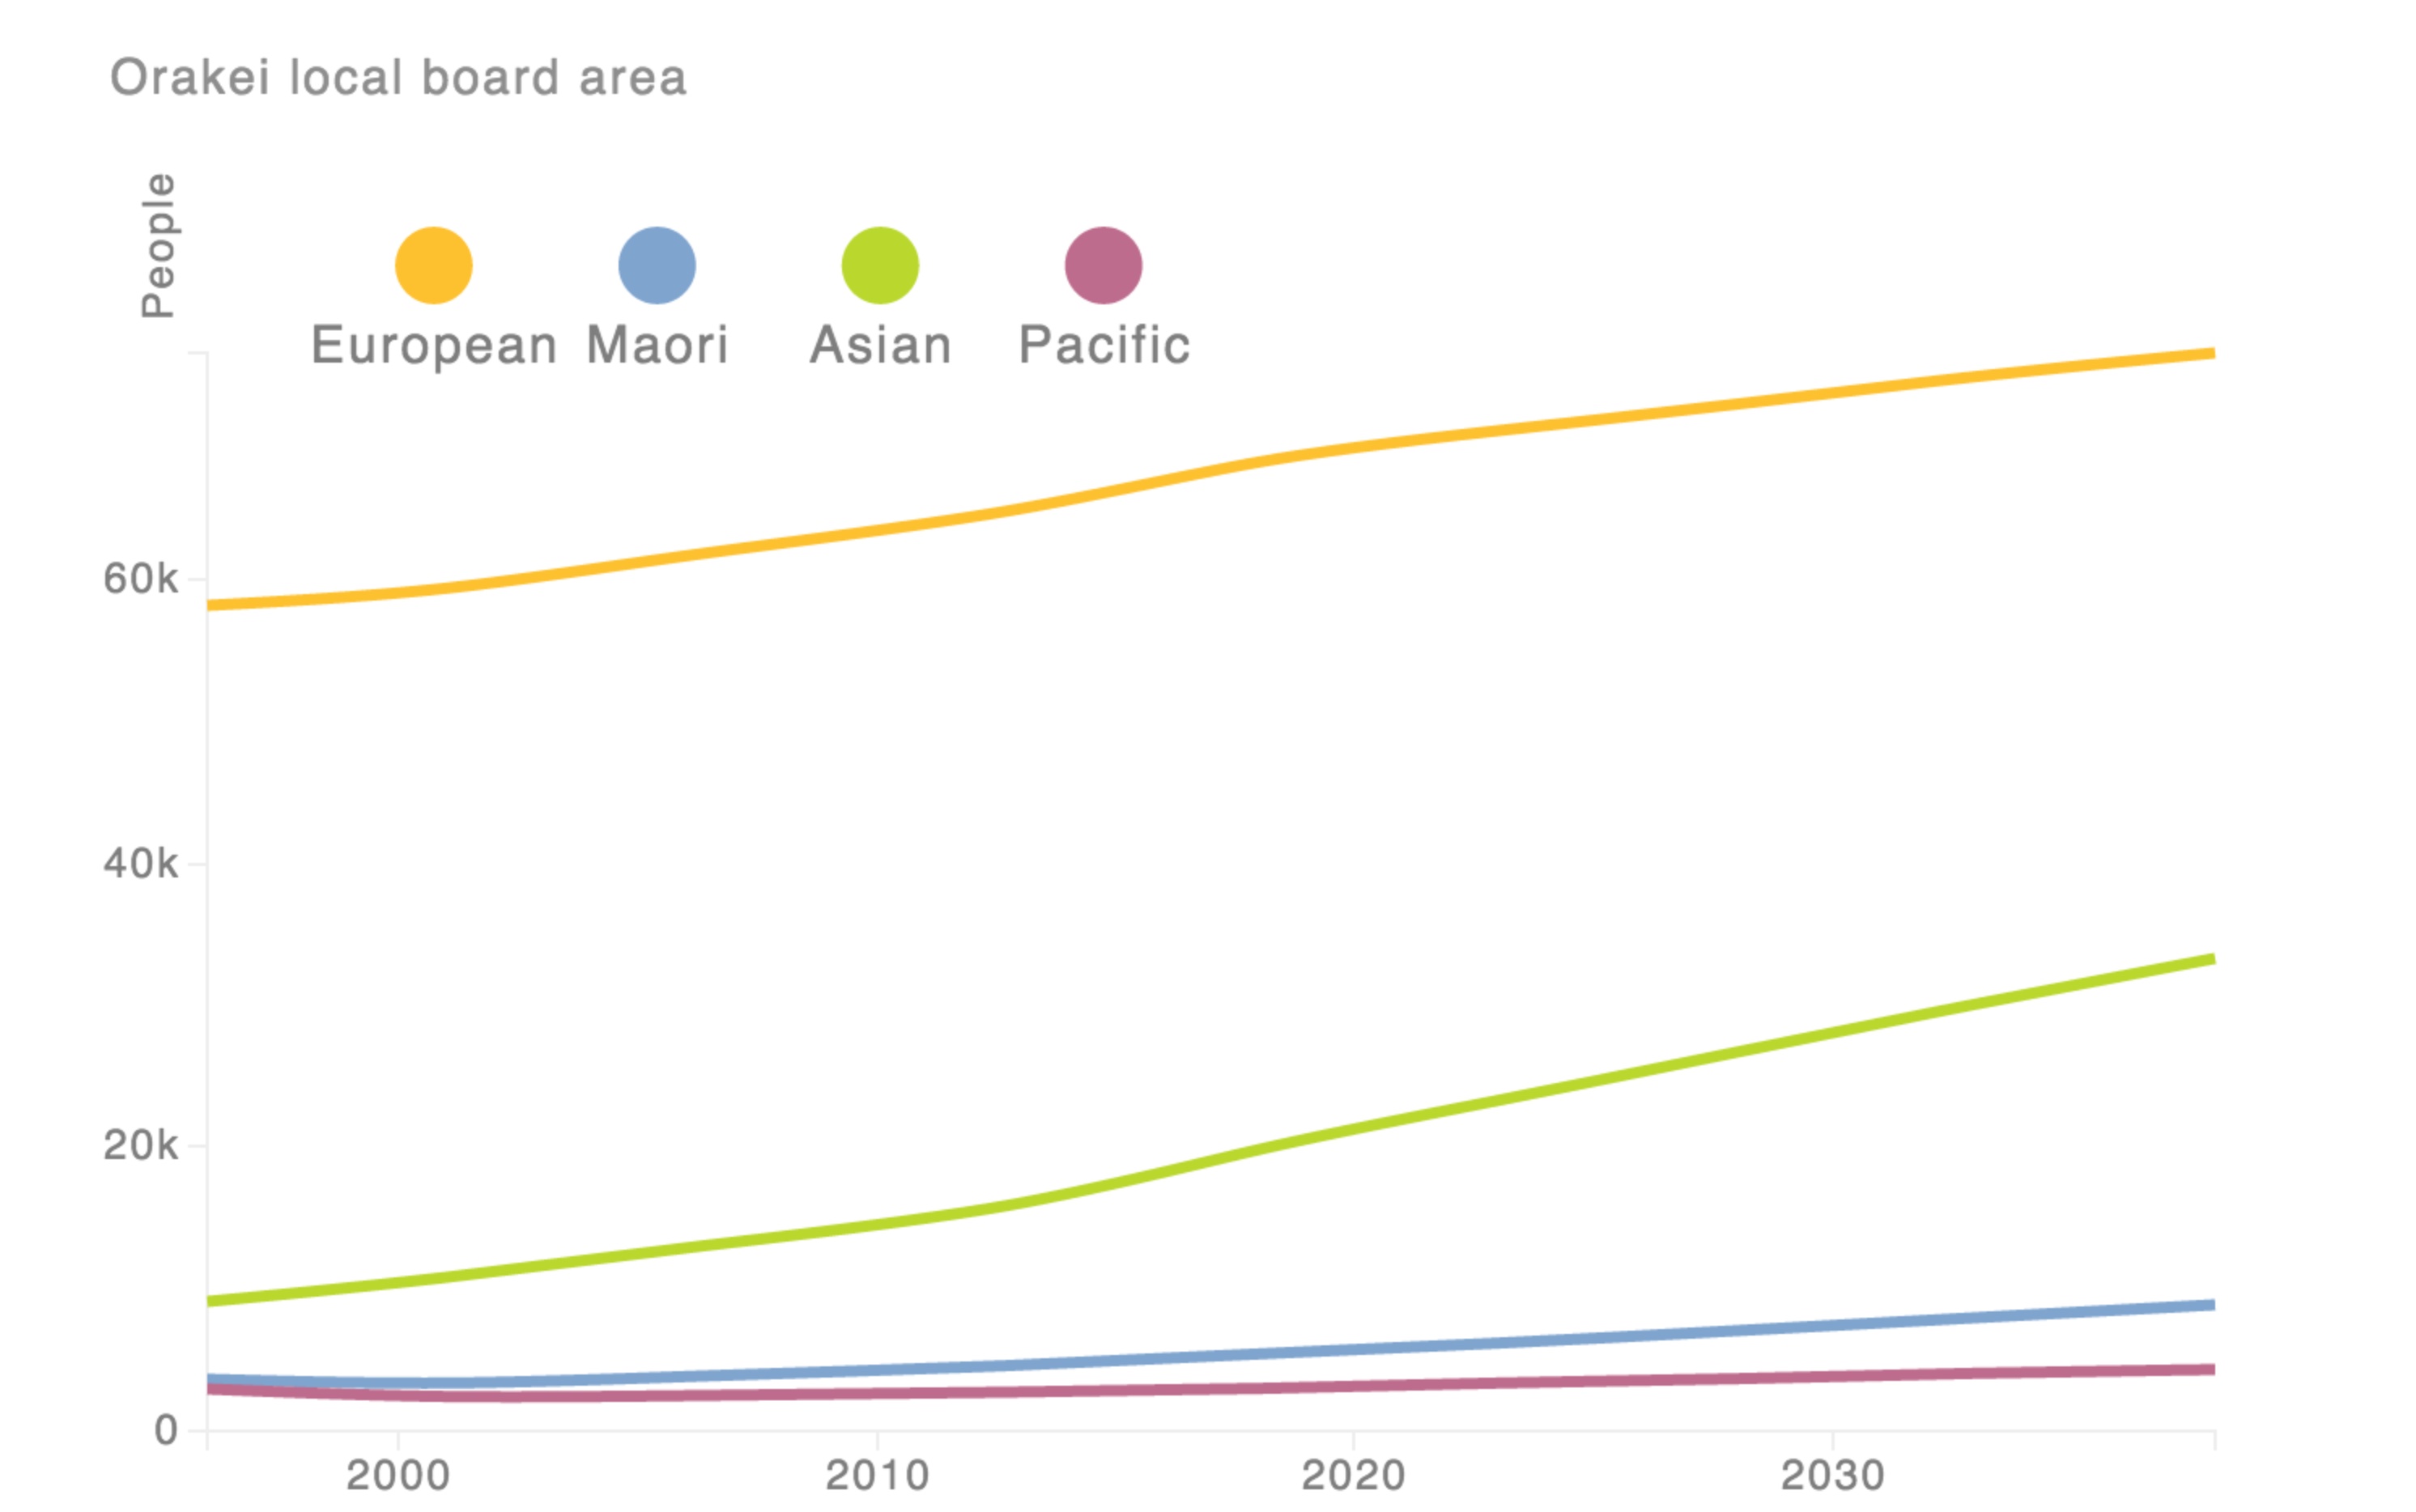
Other areas, such as Orakei board area, do not see a significant change for Maori or Pacific ethnicities. 
Change in the ethnic makeup will have more impact in some areas than others.
Asian population does change across board areas. But Asian is a broad category. It includes people from different countries with varying levels of income, education and affluence.
The overall Auckland changes shown in the graph below, hide a lot of nuance and differences at local levels. 
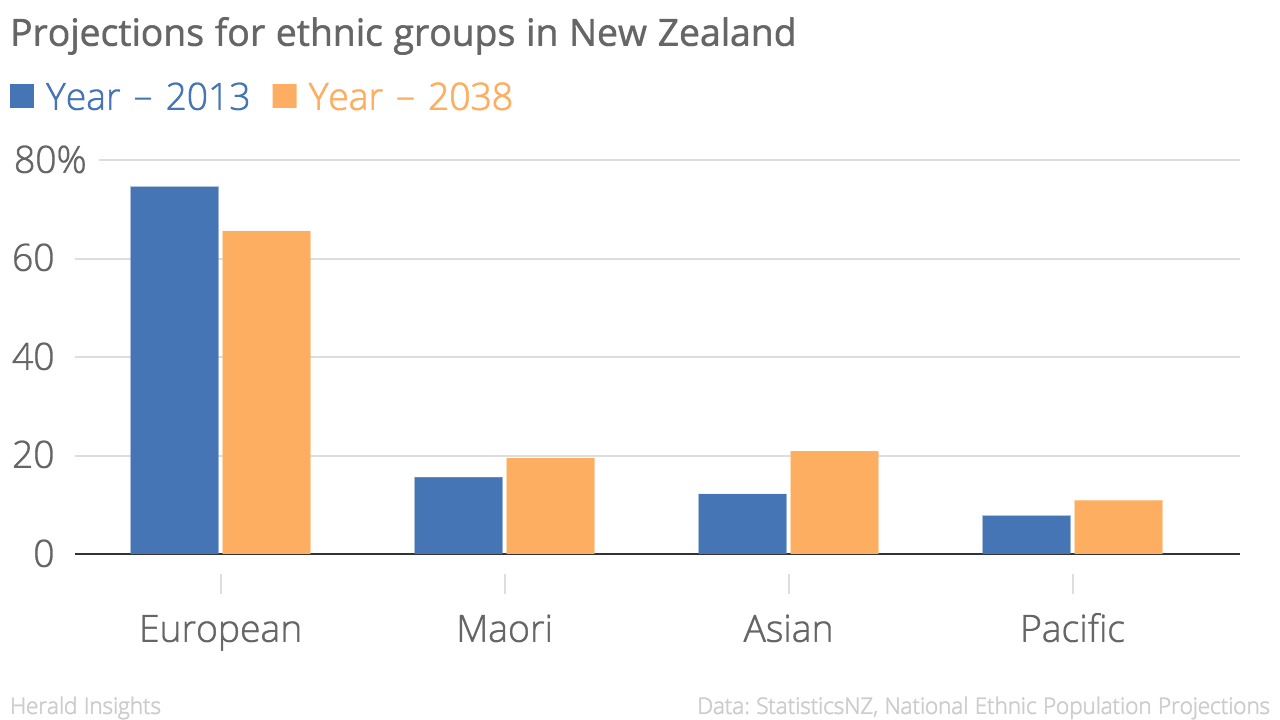
At a national level, the proportions will continue to differ from Auckland. 
Amongst territorial authorities, Wellington is one of the few places where proportion of Pacific population is projected to decline.
These proportions do not add up to 100 percent because people can chose to associate with multiple ethnicities.
Ethnicity is self perceived and people can identify with more than one ethnicity, according to Statistics NZ.
"The ethnic concept used in these projections is the ethnic group or groups that people identify with or feel they belong to. "
Despite the drop in European population from 75 percent, the overall figure rises from 110 to 115 percent.
In the case of territorial authorities, Far North District similarly sees the overall figure rise from 119 to 140 precent.
Choosing a majority ethnicity becomes a bit difficult when ethnicity itself is such a fluid concept.
Another factor resulting in multiple ethnicities is inter-marriage between various ethnic groups.
Births to parents of different ethnicities add complexity, according the accompanying report.
“The parents may consider the child to belong to one or more of their ethnicities, or indeed to another ethnicity.”
For Asian population, the growth is driven by net migration. The projection assumes a net inflow of 360K migrants nationally
While Maori and Pacific population growth is driven by high rates of birth and natural increase. This varies from one region to other.
The European population will grow in 37 territorial authorities, while declining in the other 30.
Projections are not available for Middle Eastern, Latin American, or African ethnicities because the number is too low to model future trends.
People from these ethnicities account for 1 percent of New Zealand's population. They are collectively lumped together in a category unique to New Zealand - MELAA.
54 percent of the MELAA population lived in Auckland in 2013.
The projections take into account the effect of deaths, migration, and inter-ethnic mobility within each age-sex group.
New birth group are added to the population by applying the fertility assumptions to the female population of childbearing age, and the paternity assumptions to the male population.
The projections allow for people changing their ethnic identification over time.
Projections tend to become less accurate as we go further away from the base year, in this case 2013.
These cannot be considered as an exact forecast for any geographic area.
Read the Statistics NZ report on the accuracy of the previous projections.
It states the medium projection has been more likely to under-project the population.